National Risk Management and Associates

  • Quote
  • Contact
  • Payment
  • Claims
  • Home
  • About
  • Personal
    • HOMEOWNERS Quote
    • AUTO Quote
    • Wedding Insurance
    • Special Events Insurance
  • Business
  • Life and Health
  • Our Carriers
  • Resources
  • Blog

November 1, 2021 By Reports Reports

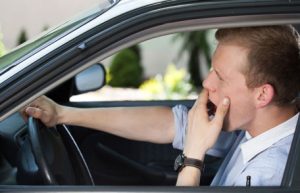
Drunk Driving Facts

Prevent Drunk DrivingCourtesy of iii.org

Alcohol is a major factor in traffic accidents. Based on data from the U.S. Department of Transportation, National Highway Traffic Safety Administration (NHTSA), there was an alcohol-impaired traffic fatality every 51 minutes in 2015.

Alcohol-impaired crashes are those that involve at least one driver or a motorcycle operator with a blood alcohol concentration (BAC) of 0.08 percent or above, the legal definition of drunk driving. According to NHTSA 10,265 people died in alcohol-impaired crashes in 2015, up 3.2 percent from 9,943 in 2014. In 2015 alcohol-impaired crash fatalities accounted for 29 percent of all crash fatalities.

The definition of drunk driving had been consistent throughout the United States until March 2017. All states and the District of Columbia defined impairment as driving with a BAC (blood alcohol concentration) at or above 0.08 percent. In addition, they all have zero tolerance laws prohibiting drivers under the age of 21 from drinking and driving. Generally the BAC limit in these cases is 0.02 percent. In March 2017, the governor of Utah signed a bill, effective December 30, 2018, that lowered the limit defining impaired driving for most drivers to 0.05 percent BAC, the lowest in the nation.

Anti-drunk-driving campaigns especially target drivers under the age of 21, repeat offenders and 21-to 34-year-olds, the age group that is responsible for more alcohol-related fatal crashes than any other. Young drivers are those least responsive to arguments against drunk driving, according to NHTSA.

To make sellers and servers of liquor more careful about to whom and how they serve drinks, 42 states and the District of Columbia have enacted laws or have case law holding commercial liquor servers legally liable for the damage, injuries and deaths a drunk driver causes. Thirty-nine states have enacted laws or have case law that permit social hosts who serve liquor to people who subsequently are involved in crashes to be held liable for any injury or death. (See chart below and Background.)

Recent developments

  • Latest data from the National Highway Traffic Safety Administration (NHTSA) indicates that the 10,265 alcohol-impaired fatalities in 2015 accounted for about one out of three highway deaths (29 percent) on U.S. roads. There were 9,943 such fatalities in 2014.
  • Ignition interlock systems require drivers to blow into a breathalyzer-like device to ensure the individual is sober before allowing the vehicle to start. According to a report released in January 2017 by the Johns Hopkins Bloomberg School of Public Health, traffic fatalities have declined by 7 percent in states that mandate ignition interlocks for first-time drunken-driving offenders. The researchers studied traffic fatalities for about five years before states began passing interlock laws in the late 1980s through 2013, when all states required them under some circumstances. See Background, Repeat Offenders.
  • Drunk Driving by Gender: Latest NHTSA data show that 14 percent of women drivers involved in fatal crashes in 2015 (1,761 drivers) were alcohol-impaired, only 1 percentage point lower than in 2006. In comparison, 21 percent of male drivers involved in fatal crashed were alcohol impaired in 2015, down from 24 percent in 2006.
  • Drunk Driving by Age: According to data from NHTSA, in 2015 the percentage of drivers in fatal crashes who were alcohol impaired was highest for 21 to 24 year old drivers, at 28 percent, followed by 25 to 34 year old drivers, at 27 percent, and 35 to 44 year old drivers, at 23 percent. The percentage of alcohol-impaired drivers in fatal crashes was 19 percent for 45 to 54 year olds, 16 percent of 16 to 20 year olds, 14 percent for 55 to 64 year olds, 9 percent for 65 to 74 year olds and 6 percent for drivers over the age of 74.
  • Drunk Driving by Vehicle Type: NHTSA data for 2015 show that 27 percent of motorcycle drivers involved in fatal crashes were alcohol impaired, compared with 21 percent of passenger car drivers and 20 percent of light truck drivers. Only 2 percent of large-truck drivers involved in fatal crashes in 2015 were alcohol impaired.
  • Social Host Liability: The Massachusetts Supreme Court ruled in February 2012 that social hosts could be held liable for off-premise injury to people caused by the drunk driving of a guest only if the host served alcohol or made it available. People who host “bring your own” parties are free from liability, even if the guest is underage. The court rejected an attempt by the parents of an injured 16-year-old to sue a party’s 18-year old host. The younger person suffered injuries in a crash in a car driven by someone who brought his own alcohol to the party. At issue was the fact that the driver, not the party host, supplied the liquor. Although the lawsuit contended that the host should be found negligent for allowing the driver to drink at her home, the court said that earlier rulings showed that hosts can’t be responsible for their guests’ drinking if they don’t control the supply of alcohol. Massachusetts law and court cases have held social hosts liable if they supply alcohol (See chart: STATUTES OR COURT CASES HOLDING ALCOHOLIC BEVERAGE SERVERS LIABLE).
  • Also in February 2012 the New Mexico Supreme Court said that circumstantial evidence of a driver’s intoxication was sufficient to support a jury finding that the driver was intoxicated, overruling a decision in a 2004 case. Evidence presented in the earlier trial showed that a driver who struck and killed a motorcyclist had a 0.09 percent blood alcohol content five hours after the crash. The owners of the gas station where the driver worked and consumed a number of beers bought at the gas station pleaded ignorance of the driver’s condition. The court ruled that the blood test results were enough to prove that the driver was intoxicated. The ruling holds liquor sellers responsible for liability where evidence is available under the existing dram shop law.

Filed Under: Insurance News

October 24, 2021 By Reports Reports

Insurance and Your Business Vehicles

Car InsuranceCourtesy of iii.org

Whether you own or lease a single business car or an entire fleet of commercial vehicles, you’ll need to purchase commercial auto insurance. Your insurance professional can help you weigh your risks and evaluate coverage options.

But even with insurance in place, you’ll want to take steps to prevent accidents and protect your employees and vehicles. Your business can reduce the chance of an accident by establishing and enforcing the following practices and policies.

Hard-and-fast driving rules

When it comes to the safety of employees and the protection of your vehicles, you should set certain firm driving rules that must be followed at all times, including:

  • Mandatory seat belt use – Nearly every state has a seat belt law. Seat belt use helps prevent deaths and limit the severity of injuries in vehicle accidents. There is no reasonable excuse for not using a seat belt.
  • Zero tolerance for intoxicants – Even one alcoholic beverage can impair a driver’s reaction time. Employees should never drink or use other intoxicants prior to using business vehicles.
  • No cellphone use – Distracted driving is a leading cause of accidents, and cellphone use while driving is banned in some states. Prohibit employees from taking calls or texting while driving.

Vehicle use guidelines

Other rules may be more flexible, but you should consider instituting policies and adhering to the following practices yourself as appropriate:

  • Limit non-business use of vehicles – While some employees use the same car for work and personal use, generally limit business vehicle use to work-related travel.
  • Slow down – Scheduling should allow sufficient travel time between meetings and assignments. Do not create such a frantic pace of work that employees are encouraged to speed. In addition to reducing the risk of accidents, driving the speed limit also will help control fuel costs.
  • Lock and secure vehicles – Employees should always lock vehicles when on the job. Whenever possible, vehicles should be parked in secure, well-lighted areas.

Employee-focused practices to reduce vehicle risk

  • Know your employees – Before hiring employees to drive company vehicles, check their driving record with the motor vehicle department for past infractions. Limit or ban driving by employees with a history of accidents or moving violations. Employees should also be required to report any accidents they have while not working. In addition, recognize that some personality traits—such as a bad temper—can raise the risk of auto accidents.
  • Provide training – Employees who regularly drive work vehicles—or are taking on a new assignment requiring vehicle use—should be provided with drivers training. This course may just be a refresher for some, but it should cover key safety practices such as following distances and proper backing techniques.
  • Recognize safe drivers – For businesses in which driving is central—such as a florist or a moving company—establish a program to recognize and reward safe drivers. You may also want to reward a department or the whole company for accident-free periods.

Responding to an accident

The above practices and policies can help minimize the risk to your business vehicles, but they cannot entirely prevent accidents from happening. If a business vehicle is involved in an accident, you’ll want to help your employee-driver respond appropriately and proceed with filing an insurance claim. The following practices and steps will help your business and the involved employee recover and get back to work.

  • Establish procedures in the event of an accident – Employees using company vehicles should be trained what to do if an accident occurs. This includes not leaving the scene of an accident, contacting the police, and collecting information (license plate numbers, contact information, insurance information, etc.) from the affected parties and any witnesses. The accident should also be reported to appropriate personnel at work. Consider using the incident as an opportunity to educate all employees who drive company vehicles about what to do if they are involved in an accident.
  • Contact your insurance professional and file a claim with your insurer – As soon as possible, contact your insurance professional to report the accident and begin the claims filing process. It’s especially important to work immediately with your insurance team if anyone has been injured in the accident. Follow the guidance of your insurer in a timely manner, such as getting estimates for repairs.

Remember too, that auto insurance claims are not limited to accidents. You may also need to file a claim if your vehicle is vandalized, stolen or damaged from an event other than an accident, such as fire or severe weather.

Filed Under: Insurance News

October 18, 2021 By Reports Reports

Join Us to Reduce Drowsy Driving

Courtesy of http://www.iii.org/fact-statistic/distracted-driving

Results of fatigue from any cause include impaired cognition and performance, motor vehicle crashes, workplace accidents, and health consequences. Research shows that fatigue is a significant factor in motor vehicle, commercial trucking and rail collisions.

  • Drowsy driving is a serious problem in the United States. According to a 2014 Centers for Disease Control and Prevention survey among nearly 150,000 adults in 19 states and the District of Columbia, about one in 25 adults reported that they had fallen asleep while driving at least once in the previous 30 days. People who snored or usually slept 6 or fewer hours per day were more likely to report falling asleep while driving.
  • The National Highway Safety Traffic Administration (NHTSA) has found that determining a precise number of drowsy-driving crashes, injuries, and fatalities is not yet possible and relies on police and hospital reports to determine the prevalance of drowsy-driving crashes.
  • NHTSA reports in 2017 there were 795 fatalities in motor vehicle crashes that involved drowsy drivers. Between 2013 and 2017 there were a total of 4,111 fatalities that involved drowsy driving. In 2017, there were 91,000 police-reported crashes that involved drowsy drivers. Those crashes led to about 50,000 people being injured.
  • A December 2016 study by the AAA Foundation for Traffic and Safety found that drivers who usually sleep for less than 5 hours daily, drivers who have slept for less than 7 hours in the past 24 hours, and drivers who have slept for 1 or more hours less than their usual amount of sleep in the past 24 hours have significantly elevated crash rates. The estimated rate ratio for crash involvement associated with driving after only 4-5 hours of sleep compared with 7 hours or more is similar to the U.S. government’s estimates of the risk associated with driving with a blood alcohol concentration equal to or slightly above the legal limit for alcohol in the U.S.
  • The Governors Highway Safety Association issued a report in August 2016 concluding that the estimated annual societal cost of fatigue-related fatal and injury crashes was $109 billion. This figure does not include property damage.
  • A 2014 AAA Traffic Safety Foundation study found that 37 percent of drivers report having fallen asleep behind the wheel at some point in their lives. An estimated 21 percent of fatal crashes, 13 percent of crashes resulting in severe injury and 6 percent of all crashes, involve a drowsy driver.
  • A 2013 study by the Federal Rail Administration found that fatigue greatly increases the chances of an accident in which human factors play a role, with the risk of such an accident rising from 11 percent to 65 percent.
  • Although sleepiness can affect all types of crashes during the entire day and night, drowsy-driving crashes most frequently occur between midnight and 6 a.m., or in the late-afternoon, according to NHTSA.
  • NHTSA found that many drowsy-driving crashes involve a single vehicle, with no passengers besides the driver, running off the road at a high rate of speed with no evidence of braking. Drowsy driving accidents frequently occur on rural roads and highways.
  • The beginning of daylight savings is linked to an increase in auto accidents, according to an analysis by the University of British Columbia and a study by researchers at John Hopkins and Stanford University.
  • In 2017, 1,306 drivers who were involved in fatal crashes (or almost 3 percent) were reported as being drowsy, as shown below:

Driving Behaviors Reported For Drivers And Motorcycle Operators Involved In Fatal Crashes, 2017

Behavior Number Percent
Driving too fast for conditions or in excess of posted limit or racing 8,856 16.9%
Under the influence of alcohol, drugs, or medication 5,507 10.5
Failure to keep in proper lane 3,826 7.3
Failure to yield right of way 3,711 7.1
Distracted (phone, talking, eating, object, etc.) 2,994 5.7
Operating vehicle in a careless manner 2,961 5.7
Failure to obey traffic signs, signals, or officer 2,095 4.0
Operating vehicle in erratic, reckless or negligent manner 1,996 3.8
Overcorrecting/oversteering 1,837 3.5
Vision obscured (rain, snow, glare, lights, building, trees, etc.) 1,581 3.0
Drowsy, asleep, fatigued, ill, or blacked out 1,306 2.5
Driving wrong way in one-way traffic or wrong side of road 1,187 2.3
Swerving or avoiding due to wind, slippery surface, etc. 1,103 2.1
Making improper turn 498 1.0
Other factors 6,225 11.9
None reported 13,421 25.7
Unknown 11,710 22.4
Total drivers (1) 52,274 (1) 100.0% (1)

(1) The sum of the numbers and percentages is greater than total drivers as more than one factor may be present for the same driver.

Source: U.S. Department of Transportation, National Highway Traffic Safety Administration.

View Archived Tables

Filed Under: Insurance News

October 10, 2021 By Reports Reports

Halloween and Pandemic Safety

Keeping Halloween SafeCourtesy of iii.org

My five-year-old nephew, Ben, is a great source of pride to his electrician father, Dan. Last Halloween, Ben refused to trick-or-treat at a particular house because he noticed that the decorations there were a fire hazard.

Halloween is supposed to be fun, but it has always involved risks and potential liabilities. The video below outlines some of the “traditional” hazards and ways to mitigate them, from eliminating trip-and-fall dangers to preventing fire and pet-related perils.

And while much of the focus of Halloween-risk mitigation is on the home, Donald R. Grady, a Boston personal injury attorney, says the biggest dangers actually involve cars.

“You see an uptick in automobile accidents,” Grady says. “Especially with teenagers, who don’t have adults with them and who rush from house to house.”

The curse of 2020

2020 has aged us all….

Perhaps predictably by now, 2020 has brought the spooky holiday threats of its own. COVID-19 has introduced new Halloween concerns.

The Centers for Disease Control and Prevention (CDC) has published a list of low-, moderate-, and high-risk Halloween activities for a time of pandemic.

Lower-risk activities include:

  • Carving or decorating pumpkins with members of your household and displaying them
  • Carving or decorating pumpkins outside, at a safe distance, with neighbors or friends
  • Decorating your house, apartment, or living space
  • Having a virtual Halloween costume contest
  • Having a Halloween movie night with people you live with.

Moderate-risk activities include:

  • Participating in one-way trick-or-treating, where individually wrapped goodie bags are lined up for families to grab and go while continuing to social distance
  • Having a small group, outdoor, open-air costume parade with people distanced more than 6 feet apart
  • Attending a costume party held outdoors, where protective masks are used and people can remain more than 6 feet apart.

The CDC provides caveats and additional guidance for these and other moderate-risk activities, so if you’re even thinking about them, definitely read the relevant guidance. It advises against the following:

  • Traditional trick-or-treating where treats are handed to children who go door to door
  • “Trunk-or-treat,” where treats are handed out from trunks of cars lined up in large parking lots
  • Attending crowded costume parties held indoors
  • Going to an indoor haunted house where people may be crowded together and screaming
  • Going on hayrides or tractor rides with people who are not in your household
  • Using alcohol or drugs, which can cloud judgement and increase risky behaviors
  • Traveling to a rural fall festival that is not in your community if you live in an area with community spread of COVID-19.

Covid-19

Filed Under: Insurance News

October 3, 2021 By Reports Reports

Driving and Seniors

Seniors InsuranceCourtesy of iii.org

Older drivers are keeping their licenses longer and driving more miles than ever before.

The high fatality rates of this age group reflect the fact that older drivers are more easily injured than younger people and are more apt to have medical complications and die of those injuries.

There is a growing need to help older drivers sharpen their skills as well as recognize their changing abilities and adapt their driving practices appropriately. Insurers have partnered with state and local governments, and groups such as AARP and the AAA Foundation for Highway Safety to create programs designed to address these needs.

Improving Older Driver Safety

According to the Governors Highway Safety Administration, impairments in three key areas—vision, cognition and motor function—are responsible for higher crash rates for older drivers. Vision declines with age; cognition, which includes memory and attention, can be impacted by medical problems such as dementia and medication side effects; and motor function suffers as flexibility declines due to diseases such as arthritis.

A 2018 report from TRIP, a nonprofit organization that studies transportation issues, calls for transportation improvements that will enable older Americans to maintain their mobility. Since there are about 46 million people age 65 or older, projected to more than double to over 98 million by 2060, roadway safety improvements are increasingly important as 90 percent of travel for this demographic takes place in a private vehicle. Almost 80 percent live in auto-dependent suburban and rural areas. Public transit accounts for only two percent of trips for older Americans. Ridesharing services can help seniors maintain their mobility although they often require the use of smartphones, which are owned by under one-third of older Americans. Self-driving and connected vehicles hold much promise for the mobility of older Americans.

Licensing requirements and restrictions

Many states routinely attempt to identify, assess and regulate older drivers with diminishing abilities who cannot or will not voluntarily modify their driving habits. According to the Insurance Institute for Highway Safety, 18 states require older drivers to renew their drivers licenses more often than the rest of the state’s residents. In addition, 18 states require more frequent vision tests for older motorists. Sixteen states and the District of Columbia prohibit older drivers from renewing licenses by mail or online. One state, Illinois, requires older drivers age 75 and over to take a road test at renewal and the District of Columbia requires a doctor’s approval for drivers over the age of 70 to renew their licenses.

Some states restrict driving activities for people with certain medical conditions or after a serious accident or traffic violation. Depending on their ability, older drivers may be limited to driving during daylight hours or on nonfreeway types of roads. In most states restrictions such as these can be placed on anyone’s drivers license, regardless of age, if his or her medical condition warrants it.

A 2014 study published in the journal Injury Epidemiology found that no policy in state drivers license renewal laws examined had a significant impact on fatal crash involvement of drivers younger than 85 years of age. However, two provisions had some effect on the involvement of older drivers in fatal crashes. Mandatory in-person renewal was associated with a 31 percent reduction in the fatal crash involvement rates of drivers ages 85 and older. In states where in-person renewal was not required, requiring drivers to pass a vision test was associated with a similar reduction for drivers age 85 and older. But in states where in-person renewal was required, mandating a vision test was not associated with any additional reduction, along with requiring a knowledge test or an on-road driving test. Results were also not statistically significant for laws that require more frequent renewal or requiring healthcare providers to report cases concerning their patients’ driving ability.

Insurance discounts

According to the National Association of Insurance Commissioners, as of January 2015, 34 states and the District of Columbia mandated premium discounts for older adults. (These state laws have not been changed since February 2013.) All but Massachusetts require older drivers (usually age 55 and over) to complete an approved-accident prevention course. In addition, 12 states mandate discounts to all drivers (including older drivers) who take defensive driving or other drivers’ education courses. In general, the state-mandated discounts apply to liability coverages because they are most relevant. The regulations can vary by state. For instance, in Massachusetts the older adult discount applies to all coverages for drivers over the age of 65.

In addition, some insurance companies offer discounts in the states in which they do business for drivers who complete defensive driving or other approved courses, including discounts for seniors who take AARP courses.

Filed Under: Insurance News

  • « Previous Page
  • 1
  • …
  • 17
  • 18
  • 19
  • 20
  • 21
  • …
  • 52
  • Next Page »

Quick Contact

(407) 767-2950

Business Hours

Monday – Friday: 9 AM- 5 PM


  • Privacy Policy

24 Hour Hotline: (407) 415-8528

National Risk Management & Associates
220 Magnolia Avenue
Sanford, FL 32771
Phone: (407) 767-2950

Copyright 2015 National Risk Management, All Rights reserved

Designed by iWebResults